NoSQL 数据库系列(十四):MongoDB 查询聚合性能优化
今天我将详细的为大家介绍 MongoDB 查询聚合优化的相关知识,希望大家能够从中收获多多!
在MongoDB中通过查询聚合语句分析定位慢查询/聚合分析。
问题描述
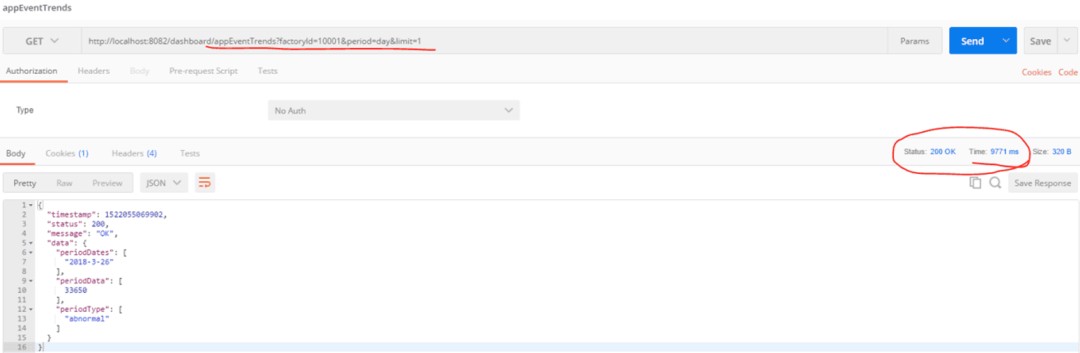
执行BI服务的接口, 发现返回一天的记录需要10s左右,这明显是有问题:
问题分析
定位慢查询
为了定位查询,需要查看当前mongo profile的级别, profile的级别有0|1|2,分别代表意思: 0代表关闭,1代表记录慢命令,2代表全部。
db.getProfilingLevel()
显示为0, 表示默认下是没有记录的。
设置profile级别,设置为记录慢查询模式, 所有超过1000ms的查询语句都会被记录下来。
db.setProfilingLevel(1, 1000)
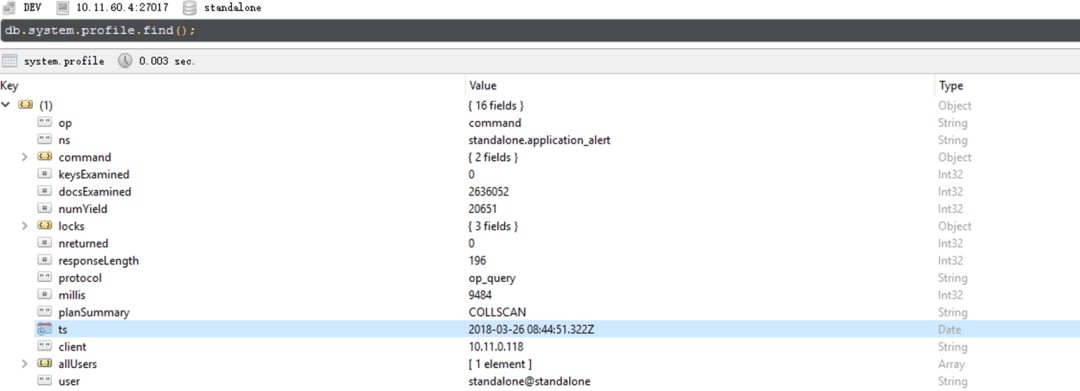
再次执行BI一天的查询接口,查看Profile, 发现确实记录了这条慢查询:
分析慢查询语句
通过view document查看慢查询的profile记录。
{
    "op" : "command",
    "ns" : "standalone.application_alert",
    "command" : {
        "aggregate" : "application_alert",
        "pipeline" : [
            {
                "$match" : {
                    "factoryId" : "10001",
                    "$and" : [
                        {
                            "insertTime" : {
                                "$gte" : ISODate("2018-03-25T16:00:00.000Z"),
                                "$lte" : ISODate("2018-03-26T09:04:20.288Z")
                            }
                        }
                    ]
                }
            },
            {
                "$project" : {
                    "eventType" : 1,
                    "date" : {
                        "$concat" : [
                            {
                                "$substr" : [
                                    {
                                        "$year" : [
                                            "$insertTime"
                                        ]
                                    },
                                    0,
                                    4
                                ]
                            },
                            "-",
                            {
                                "$substr" : [
                                    {
                                        "$month" : [
                                            "$insertTime"
                                        ]
                                    },
                                    0,
                                    2
                                ]
                            },
                            "-",
                            {
                                "$substr" : [
                                    {
                                        "$dayOfMonth" : [
                                            "$insertTime"
                                        ]
                                    },
                                    0,
                                    2
                                ]
                            }
                        ]
                    }
                }
            },
            {
                "$group" : {
                    "_id" : {
                        "date" : "$date",
                        "eventType" : "$eventType"
                    },
                    "count" : {
                        "$sum" : 1
                    }
                }
            }
        ]
    },
    "keysExamined" : 0,
    "docsExamined" : 2636052,
    "numYield" : 20651,
    "locks" : {
        "Global" : {
            "acquireCount" : {
                "r" : NumberLong(41310)
            }
        },
        "Database" : {
            "acquireCount" : {
                "r" : NumberLong(20655)
            }
        },
        "Collection" : {
            "acquireCount" : {
                "r" : NumberLong(20654)
            }
        }
    },
    "nreturned" : 0,
    "responseLength" : 196,
    "protocol" : "op_query",
    "millis" : 9484,
    "planSummary" : "COLLSCAN",
    "ts" : ISODate("2018-03-26T08:44:51.322Z"),
    "client" : "10.11.0.118",
    "allUsers" : [
        {
            "user" : "standalone",
            "db" : "standalone"
        }
    ],
    "user" : "standalone@standalone"
}
从上面profile中可以看到我们执行的BI 查询接口对应到Mongo执行了一个pipleline:
- 第一步: match 工厂ID是10001的记录,时间段是当前一天
{
       "$match" : {
           "factoryId" : "10001",
           "$and" : [
               {
                   "insertTime" : {
                       "$gte" : ISODate("2018-03-25T16:00:00.000Z"),
                       "$lte" : ISODate("2018-03-26T09:04:20.288Z")
                   }
               }
           ]
       }
   },
- 第二步: 字段映射,project:
{
      "$project" : {
          "eventType" : 1,
          "date" : {
              "$concat" : [
                  {
                      "$substr" : [
                          {
                              "$year" : [
                                  "$insertTime"
                              ]
                          },
                          0,
                          4
                      ]
                  },
                  "-",
                  {
                      "$substr" : [
                          {
                              "$month" : [
                                  "$insertTime"
                              ]
                          },
                          0,
                          2
                      ]
                  },
                  "-",
                  {
                      "$substr" : [
                          {
                              "$dayOfMonth" : [
                                  "$insertTime"
                              ]
                          },
                          0,
                          2
                      ]
                  }
              ]
          }
      }
  },
可以看到除了对event_type做了简单的project外,还对insertTime字段做了拼接,拼接为yyyy-MM-dd格式,并且project为date字段。
- 第三步: group操作
{
    "$group" : {
        "_id" : {
            "date" : "$date",
            "eventType" : "$eventType"
        },
        "count" : {
            "$sum" : 1
        }
    }
对#2中的date和event_type进行group,统计不同日期和事件类型所对应的事件数量(count).
对应的其它字段:
- Mills: 花了9484毫秒返回查询结果
- ts: 命令执行时间
- info: 命令的内容
- query: 代表查询
- ns: standalone.application_alert 代表查询的库与集合
- nreturned: 返回记录数及用时
- reslen: 返回的结果集大小,byte数
- nscanned: 扫描记录数量
如果发现9484毫秒时间比较长,那么就需要作优化。
通常来说,经验上可以对这些指标做参考:
- 比如nscanned数很大,或者接近记录总数,那么可能没有用到索引查询。
- reslen很大,有可能返回没必要的字段。
- nreturned很大,那么有可能查询的时候没有加限制。
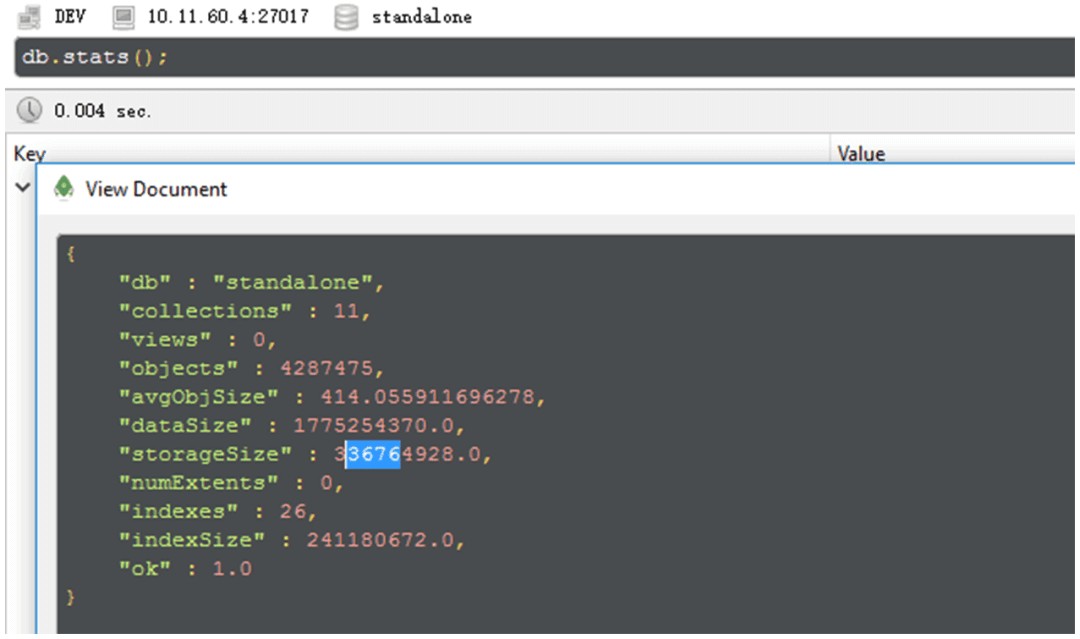
查看DB/Server/Collection的状态
- DB status
- 查看Server状态
由于server 状态指标众多,我这边只列出来一部分。
{
    "host" : "OPASTORMON", #主机名
    "version" : "3.4.1", #版本号
    "process" : "mongod", #进程名
    "pid" : NumberLong(1462), #进程ID
    "uptime" : 10111875.0, #运行时间
    "uptimeMillis" : NumberLong(10111875602), #运行时间
    "uptimeEstimate" : NumberLong(10111875), #运行时间
    "localTime" : ISODate("2018-03-26T09:14:13.679Z"), #当前时间
    "asserts" : {
        "regular" : 0,
        "warning" : 0,
        "msg" : 0,
        "user" : 26549,
        "rollovers" : 0
    },
    "connections" : {
        "current" : 104, #当前链接数
        "available" : 715, #可用链接数
        "totalCreated" : 11275
    },
    "extra_info" : {
        "note" : "fields vary by platform",
        "page_faults" : 49
    },
    "globalLock" : {
        "totalTime" : NumberLong(10111875549000), #总运行时间(ns)
        "currentQueue" : {
            "total" : 0, #当前需要执行的队列
            "readers" : 0, #读队列
            "writers" : 0 #写队列
        },
        "activeClients" : {
            "total" : 110, #当前客户端执行的链接数
            "readers" : 0, #读链接数
            "writers" : 0 #写链接数
        }
    },
    "locks" : {
        "Global" : {
            "acquireCount" : {
                "r" : NumberLong(8457368136),
                "w" : NumberLong(1025512487),
                "W" : NumberLong(7)
            },
            "acquireWaitCount" : {
                "r" : NumberLong(2)
            },
            "timeAcquiringMicros" : {
                "r" : NumberLong(94731)
            }
        },
        "Database" : {
            "acquireCount" : {
                "r" : NumberLong(3715927334),
                "w" : NumberLong(1025512452),
                "R" : NumberLong(194),
                "W" : NumberLong(69)
            },
            "acquireWaitCount" : {
                "r" : NumberLong(13),
                "w" : NumberLong(5),
                "R" : NumberLong(6),
                "W" : NumberLong(3)
            },
            "timeAcquiringMicros" : {
                "r" : NumberLong(530972),
                "w" : NumberLong(426173),
                "R" : NumberLong(3207),
                "W" : NumberLong(1321)
            }
        },
        "Collection" : {
            "acquireCount" : {
                "r" : NumberLong(3715046899),
                "w" : NumberLong(1025512453)
            }
        },
        "Metadata" : {
            "acquireCount" : {
                "w" : NumberLong(1),
                "W" : NumberLong(3)
            }
        }
    },
    "network" : {
        "bytesIn" : NumberLong(373939915493), #输入数据(byte)
        "bytesOut" : NumberLong(961227224728), #输出数据(byte)
        "physicalBytesIn" : NumberLong(373939915493),#物理输入数据(byte)
        "physicalBytesOut" : NumberLong(961054421482),#物理输入数据(byte)
        "numRequests" : NumberLong(3142377739) #请求数
    },
    "opLatencies" : {
        "reads" : {
            "latency" : NumberLong(3270742192035),
            "ops" : NumberLong(540111914)
        },
        "writes" : {
            "latency" : NumberLong(261946981235),
            "ops" : NumberLong(1024301418)
        },
        "commands" : {
            "latency" : NumberLong(458086641),
            "ops" : NumberLong(6776702)
        }
    },
    "opcounters" : {
        "insert" : 6846448, #插入操作数
        "query" : 248443106, #查询操作数
        "update" : 1018594976, #更新操作数
        "delete" : 1830, #删除操作数
        "getmore" : 162213, #获取更多的操作数
        "command" : 298306448 #其他命令操作数
    },
    "opcountersRepl" : {
        "insert" : 0,
        "query" : 0,
        "update" : 0,
        "delete" : 0,
        "getmore" : 0,
        "command" : 0
    },
    "storageEngine" : {
        "name" : "wiredTiger",
        "supportsCommittedReads" : true,
        "readOnly" : false,
        "persistent" : true
    },
    "tcmalloc" : {
        "generic" : {
            "current_allocated_bytes" : NumberLong(3819325752),
            "heap_size" : NumberLong(6959509504)
        },
        "tcmalloc" : {
            "pageheap_free_bytes" : 199692288,
            "pageheap_unmapped_bytes" : NumberLong(2738442240),
            "max_total_thread_cache_bytes" : NumberLong(1073741824),
            "current_total_thread_cache_bytes" : 35895120,
            "total_free_bytes" : 202049224,
            "central_cache_free_bytes" : 165650360,
            "transfer_cache_free_bytes" : 503744,
            "thread_cache_free_bytes" : 35895120,
            "aggressive_memory_decommit" : 0,
              "formattedString" :
"------------------------------------------------
MALLOC:     3819325752 ( 3642.4 MiB) Bytes in use by application
MALLOC: +    199692288 (  190.4 MiB) Bytes in page heap freelist
MALLOC: +    165650360 (  158.0 MiB) Bytes in central cache freelist
MALLOC: +       503744 (    0.5 MiB) Bytes in transfer cache freelist
MALLOC: +     35895120 (   34.2 MiB) Bytes in thread cache freelists
MALLOC: +     40001728 (   38.1 MiB) Bytes in malloc metadata
MALLOC:   ------------
MALLOC: =   4261068992 ( 4063.7 MiB) Actual memory used (physical + swap)
MALLOC: +   2738442240 ( 2611.6 MiB) Bytes released to OS (aka unmapped)
MALLOC:   ------------
MALLOC: =   6999511232 ( 6675.3 MiB) Virtual address space used
MALLOC:
MALLOC:         521339              Spans in use
MALLOC:            115              Thread heaps in use
MALLOC:           4096              Tcmalloc page size
------------------------------------------------
Call ReleaseFreeMemory() to release freelist memory to the OS (via madvise()).
Bytes released to the OS take up virtual address space but no physical memory."
        }
    },
    "mem" : {
        "bits" : 64, #64位系统
        "resident" : 4103, #占有物理内存数
        "virtual" : 7045, #占有虚拟内存
        "supported" : true, #是否支持扩展内存
        "mapped" : 0,
        "mappedWithJournal" : 0
    },
    "ok" : 1.0
}- 查看application_alert这个collection的状态
- 查看application_alert这个collection的状态
{
    "ns" : "standalone.application_alert",
    "size" : 783852548,
    "count" : 2638262,
    "avgObjSize" : 297,
    "storageSize" : 189296640,
    "capped" : false,
    "wiredTiger" : {
        "metadata" : {
            "formatVersion" : 1
        },
        "creationString" : "allocation_size=4KB,
         app_metadata=(formatVersion=1),
         block_allocation=best,
         block_compressor=snappy,
         cache_resident=false,
         checksum=on,
         colgroups=,
collator=,
columns=,
dictionary=0,
encryption=(keyid=,name=),
exclusive=false,
extractor=,
format=btree,
huffman_key=,
huffman_value=,
ignore_in_memory_cache_size=false,
immutable=false,
internal_item_max=0,
internal_key_max=0,
internal_key_truncate=true,
internal_page_max=4KB,
key_format=q,key_gap=10,
leaf_item_max=0,
leaf_key_max=0,
leaf_page_max=32KB,
leaf_value_max=64MB,
log=(enabled=true),
lsm=(auto_throttle=true,bloom=true,bloom_bit_count=16,bloom_config=,bloom_hash_count=8,bloom_oldest=false,chunk_count_limit=0,chunk_max=5GB,chunk_size=10MB,merge_max=15,merge_min=0),
memory_page_max=10m,
os_cache_dirty_max=0,
os_cache_max=0,
prefix_compression=false,
prefix_compression_min=4,
source=,
split_deepen_min_child=0,
split_deepen_per_child=0,
split_pct=90,
type=file,
value_format=u",
        "type" : "file",
        "uri" : "statistics:table:collection-4-6040851502998278747",
        "LSM" : {
            "bloom filter false positives" : 0,
            "bloom filter hits" : 0,
            "bloom filter misses" : 0,
            "bloom filter pages evicted from cache" : 0,
            "bloom filter pages read into cache" : 0,
            "bloom filters in the LSM tree" : 0,
            "chunks in the LSM tree" : 0,
            "highest merge generation in the LSM tree" : 0,
            "queries that could have benefited from a Bloom filter that did not exist" : 0,
            "sleep for LSM checkpoint throttle" : 0,
            "sleep for LSM merge throttle" : 0,
            "total size of bloom filters" : 0
        },
        "block-manager" : {
            "allocations requiring file extension" : 31543,
            "blocks allocated" : 346110,
            "blocks freed" : 124238,
            "checkpoint size" : 189259776,
            "file allocation unit size" : 4096,
            "file bytes available for reuse" : 20480,
            "file magic number" : 120897,
            "file major version number" : 1,
            "file size in bytes" : 189296640,
            "minor version number" : 0
        },
        "btree" : {
            "btree checkpoint generation" : 165242,
            "column-store fixed-size leaf pages" : 0,
            "column-store internal pages" : 0,
            "column-store variable-size RLE encoded values" : 0,
            "column-store variable-size deleted values" : 0,
            "column-store variable-size leaf pages" : 0,
            "fixed-record size" : 0,
            "maximum internal page key size" : 368,
            "maximum internal page size" : 4096,
            "maximum leaf page key size" : 2867,
            "maximum leaf page size" : 32768,
            "maximum leaf page value size" : 67108864,
            "maximum tree depth" : 3,
            "number of key/value pairs" : 0,
            "overflow pages" : 0,
            "pages rewritten by compaction" : 0,
            "row-store internal pages" : 0,
            "row-store leaf pages" : 0
        },
        "cache" : {
            "bytes currently in the cache" : 1014702364,
            "bytes read into cache" : 0,
            "bytes written from cache" : 1888143292.0,
            "checkpoint blocked page eviction" : 0,
            "data source pages selected for eviction unable to be evicted" : 0,
            "hazard pointer blocked page eviction" : 0,
            "in-memory page passed criteria to be split" : 224,
            "in-memory page splits" : 112,
            "internal pages evicted" : 0,
            "internal pages split during eviction" : 0,
            "leaf pages split during eviction" : 0,
            "modified pages evicted" : 2,
            "overflow pages read into cache" : 0,
            "overflow values cached in memory" : 0,
            "page split during eviction deepened the tree" : 0,
            "page written requiring lookaside records" : 0,
            "pages read into cache" : 0,
            "pages read into cache requiring lookaside entries" : 0,
            "pages requested from the cache" : 49191856,
            "pages written from cache" : 217176,
            "pages written requiring in-memory restoration" : 0,
            "unmodified pages evicted" : 0
        },
        "cache_walk" : {
            "Average difference between current eviction generation when the page was last considered" : 0,
            "Average on-disk page image size seen" : 0,
            "Clean pages currently in cache" : 0,
            "Current eviction generation" : 0,
            "Dirty pages currently in cache" : 0,
            "Entries in the root page" : 0,
            "Internal pages currently in cache" : 0,
            "Leaf pages currently in cache" : 0,
            "Maximum difference between current eviction generation when the page was last considered" : 0,
            "Maximum page size seen" : 0,
            "Minimum on-disk page image size seen" : 0,
            "On-disk page image sizes smaller than a single allocation unit" : 0,
            "Pages created in memory and never written" : 0,
            "Pages currently queued for eviction" : 0,
            "Pages that could not be queued for eviction" : 0,
            "Refs skipped during cache traversal" : 0,
            "Size of the root page" : 0,
            "Total number of pages currently in cache" : 0
        },
        "compression" : {
            "compressed pages read" : 0,
            "compressed pages written" : 83604,
            "page written failed to compress" : 0,
            "page written was too small to compress" : 133572,
            "raw compression call failed, additional data available" : 0,
            "raw compression call failed, no additional data available" : 0,
            "raw compression call succeeded" : 0
        },
        "cursor" : {
            "bulk-loaded cursor-insert calls" : 0,
            "create calls" : 78758,
            "cursor-insert key and value bytes inserted" : 795578636,
            "cursor-remove key bytes removed" : 8857,
            "cursor-update value bytes updated" : 0,
            "insert calls" : 2642785,
            "next calls" : 5850718215.0,
            "prev calls" : 3,
            "remove calls" : 4460,
            "reset calls" : 48942545,
            "restarted searches" : 0,
            "search calls" : 10229,
            "search near calls" : 46285468,
            "truncate calls" : 0,
            "update calls" : 0
        },
        "reconciliation" : {
            "dictionary matches" : 0,
            "fast-path pages deleted" : 0,
            "internal page key bytes discarded using suffix compression" : 7946666,
            "internal page multi-block writes" : 60010,
            "internal-page overflow keys" : 0,
            "leaf page key bytes discarded using prefix compression" : 0,
            "leaf page multi-block writes" : 64250,
            "leaf-page overflow keys" : 0,
            "maximum blocks required for a page" : 253,
            "overflow values written" : 0,
            "page checksum matches" : 10496129,
            "page reconciliation calls" : 189077,
            "page reconciliation calls for eviction" : 1,
            "pages deleted" : 7
        },
        "session" : {
            "object compaction" : 0,
            "open cursor count" : 35
        },
        "transaction" : {
            "update conflicts" : 0
        }
    },
    "nindexes" : 1,
    "totalIndexSize" : 24420352,
    "indexSizes" : {
        "_id_" : 24420352
    },
    "ok" : 1.0
}
性能优化
性能优化 - 索引
通过上述的指标,需要优化的话,第一考虑的是查看是否对该collection创建了索引:
- 查看是否有相关索引
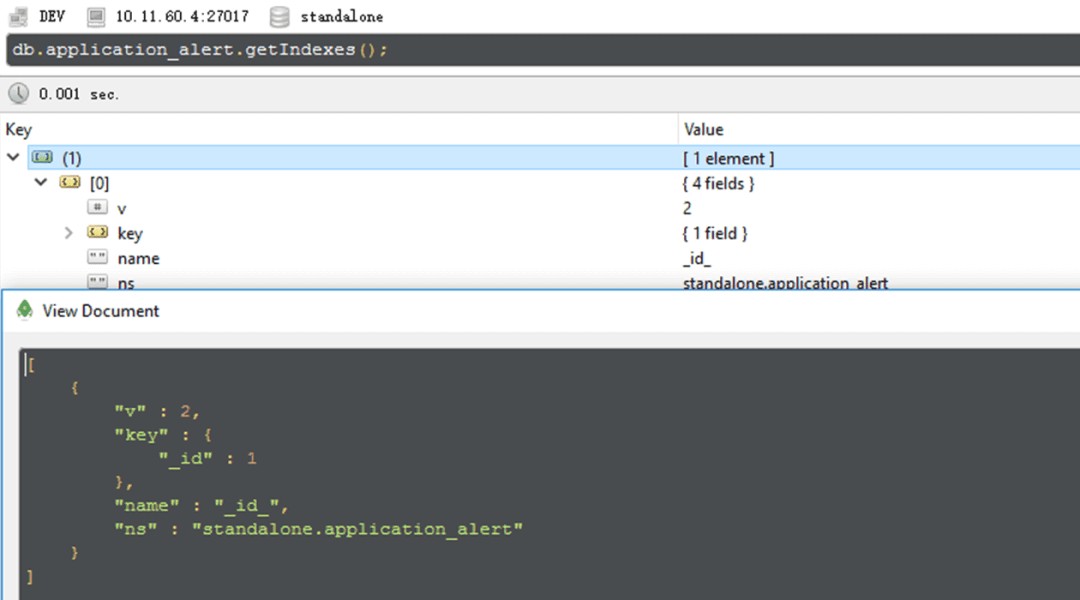
- 增加相关字段的搜索索引 发现只有对id的索引,所以接下来对application_alert创建event_type和factory_id,timeStamp字段的索引。
db.application_alert.ensureIndex({"insertTime": 1, "eventType": 1});
db.application_alert.ensureIndex({"insertTime": 1});
db.application_alert.ensureIndex({"eventType": 1});
db.application_alert.ensureIndex({"factoryId": 1});
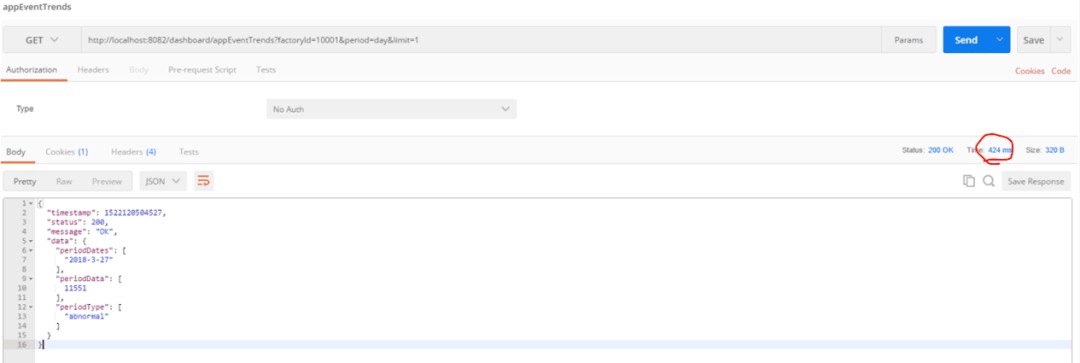
查看增加index后查询一天的数据聚合需要424ms, 基本可以接受。
查询20天,看时间仍然需要20s
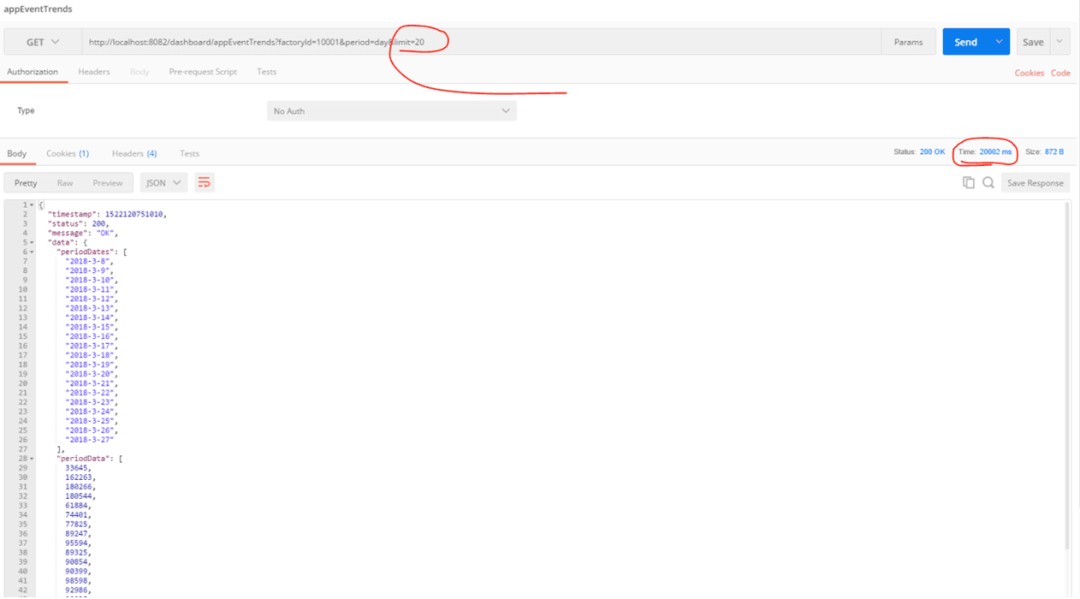
通过增加索引小结 到这里我们基本可以看到添加查询index对BI接口的影响,索引的添加只是解决了针对索引字段查询的效率,但是并不能解决查询之后数据的聚合问题。对一天而言由于数据量的少,查询速度提升显著,但是对大量数据做聚合仍然不合适。
我们通过增加索引解决了什么问题?
在没有索引的前提下,找出100万条{eventType: "abnormal"}需要多少时间? 全表扫描COLLSCAN从700w条数据中找出600w条,跟从1亿条数据中找出600w条显然是两个概念。命中索引IXSCAN,这个差异就会小很多,几乎可以忽略。索引的添加只是解决了针对索引字段查询的效率,但是并不能解决查询之后数据的聚合问题。顺便应该提一下看效率是否有差异应该看执行计划,不要看执行时间,时间是不准确的。
性能优化 - 聚合大量数据
那问题是,如何解决这种查询聚合大量数据的问题呢?
首先要说明的一个问题是,对于OLAP型的操作,期望不应该太高。毕竟是对于大量数据的操作,光从IO就已经远超通常的OLTP操作,所以要求达到OLTP操作的速度和并发是不现实的,也是没有意义的。但并不是说一点优化空间也没有。
这样优化之后预计在可以提升一部分查询性能,但是并不能解决。原因开头说了,对OLAP就不能期望这么高。如果你真有这方面的需求,就应该从源头入手,考虑:
- 每次info字段有更新或插入时就做好计数
- 每隔一段时间做一次完整的统计,缓存统计结果,查询的时候直接展现给用户
小结
- 慢查询定位: 通过Profile分析慢查询
- 对于查询优化: 通过添加相应索引提升查询速度;
- 对于聚合大数据方案: 首先要说明的一个问题是,对于OLAP型的操作,期望不应该太高。毕竟是对于大量数据的操作,光从IO就已经远超通常的OLTP操作,所以要求达到OLTP操作的速度和并发是不现实的,也是没有意义的。但并不是说一点优化空间也没有。
这样优化之后预计在可以提升一部分查询性能,但是并不能解决。原因开头说了,对OLAP就不能期望这么高,应该从源头入手,考虑:
- 每次eventType字段和insertTime有更新或插入时就做好计数
- 每隔一段时间做一次完整的统计,缓存统计结果,查询的时候直接展现给用户
- 发表于 2023-06-14 19:32
- 阅读 ( 37 )
