1.前言
Oracle中有ASH(Active Session History),ASH通过每秒钟抽取活动会话样本,为分析在最近时刻的性能问题提供最直接有效的依据。
在PostgreSQL中,一般出现性能问题,都会结合pg_stat_ac...
1.前言
Oracle中有ASH(Active Session History),ASH通过每秒钟抽取活动会话样本,为分析在最近时刻的性能问题提供最直接有效的依据。
在PostgreSQL中,一般出现性能问题,都会结合pg_stat_activity和操作系统提供的命令,如top、iostat观察,不幸的是,pg_stat_activity该视图只能看到当前运行着的Postgres进程列表,为该时间点的快照,只能大致告诉我们,此刻数据库的运行状况,好在PostgreSQL有一个插件:pgSentinel(the sampling approach for PostgreSQL),类似Oracle中的ASH,可以让我们追本溯源,什么妖魔SQL都会有记录。pgSentinel支持9.6及9.6以后的版本。
2.实操
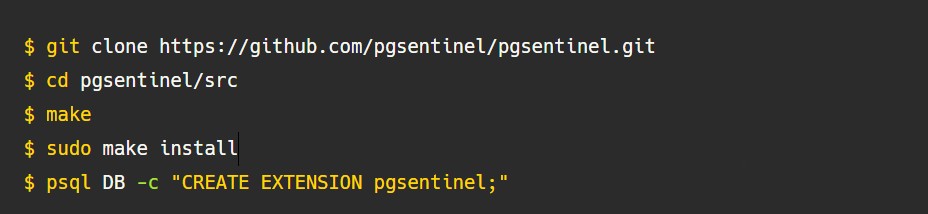
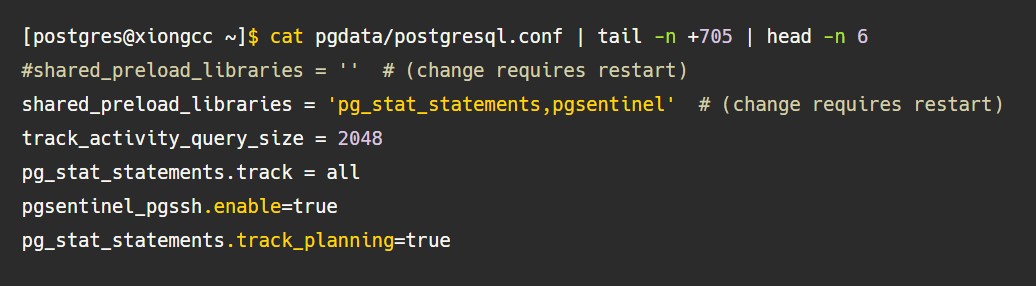
安装extension很快,同时需要在postgresql.conf中指定shared_preload_libraries来加载该插件。https://github.com/pgsentinel/pgsentinel
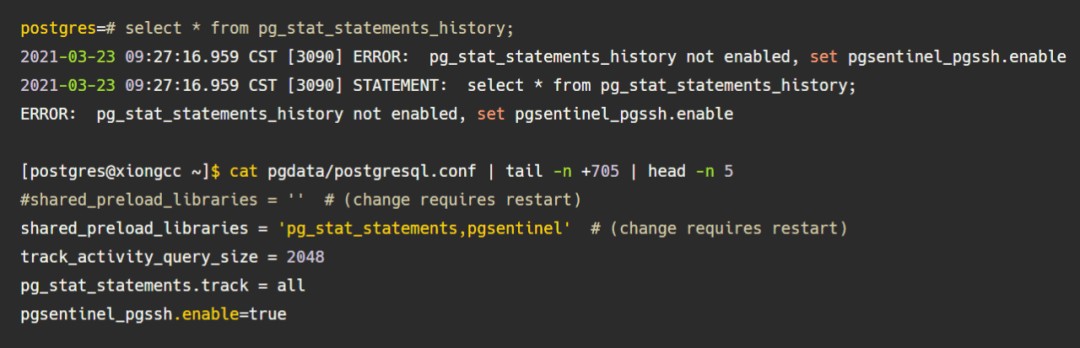
安装完成插件后,如果不启动postgresql服务,直接创建扩展命令报错:
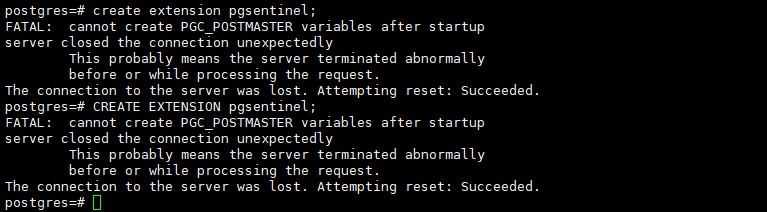
所有重启postgresql服务后,再 create extension pgsentinel 才成功。
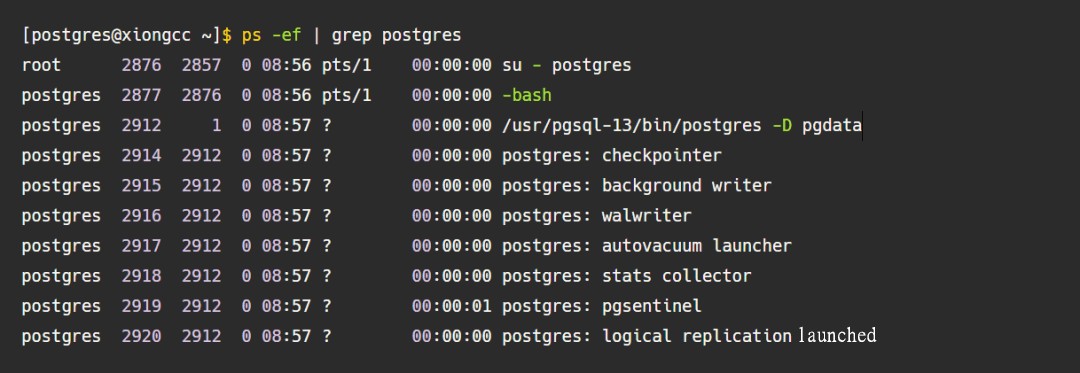
安装好之后,会fork一个pgsentinel的后台进程
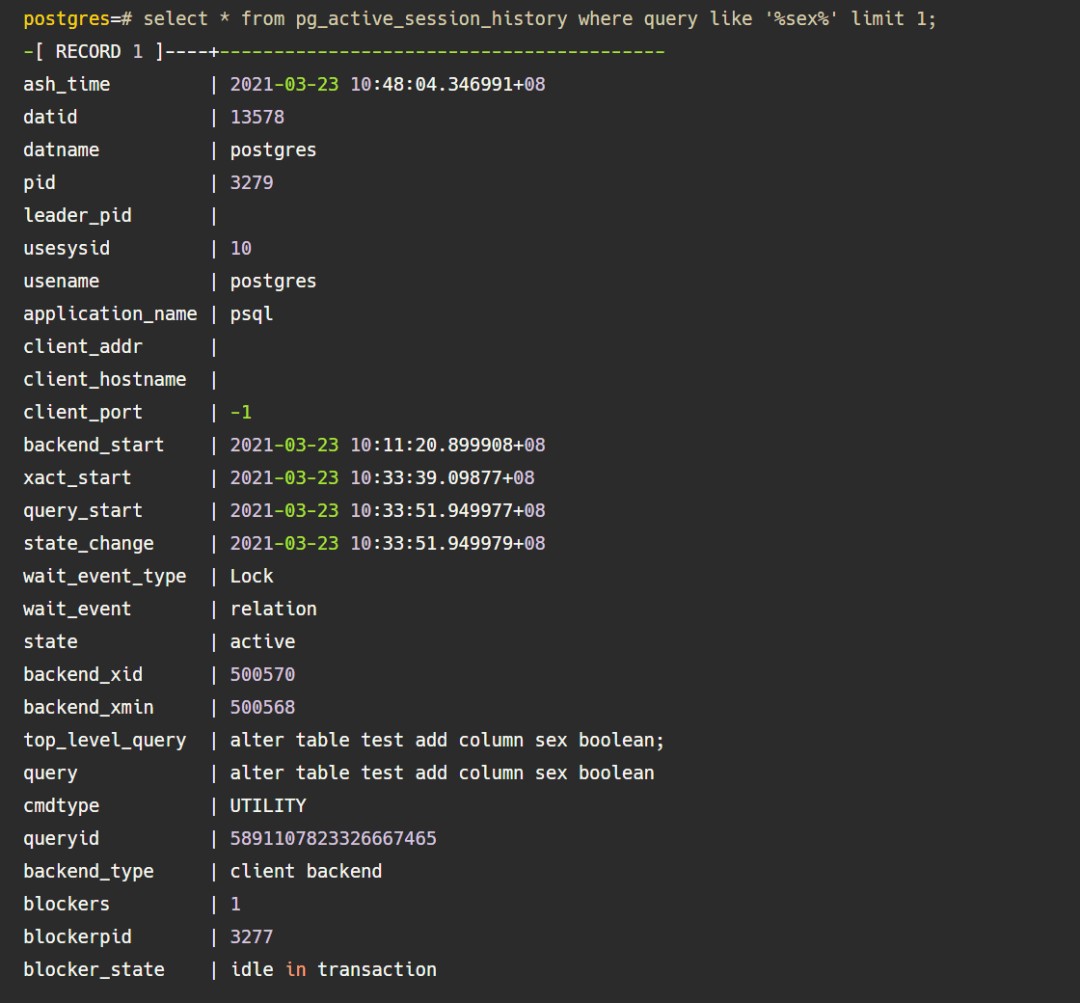
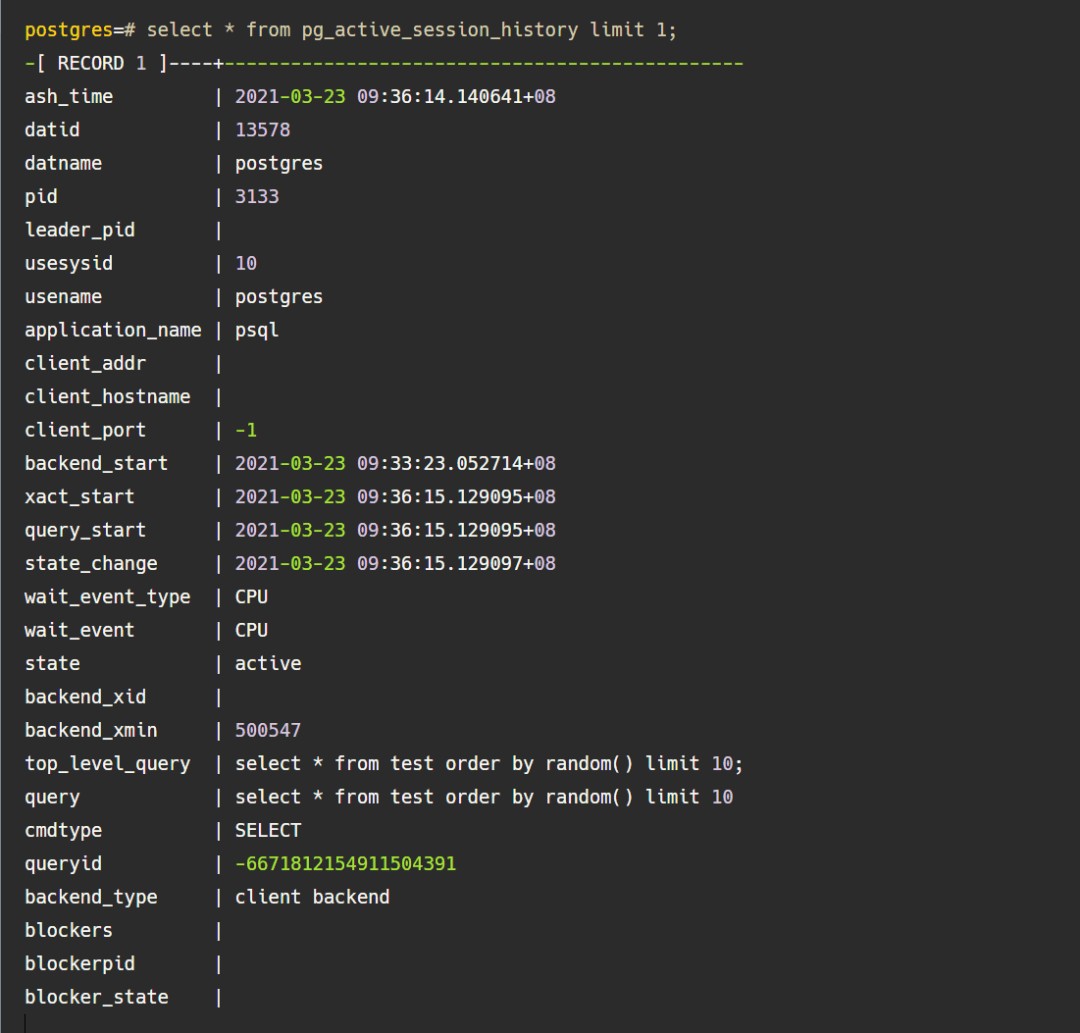
同时为了获取更多细粒度的查询,pgsentinel还会对pg_stat_statements视图进行采样。可以看一下pg_active_session_history,十分眼熟,就是在pg_stat_activity的基础上额外添加了一些字段,其中blockers、blockpid、blocker_state很好用。
所以这就大大方便了我们,历史执行会话的状态快照会保存在该视图中,可以用来审计、溯源等等。
1)ash_time: the sampling time,采样的时间2)top_level_query: the top level statement (in case PL/pgSQL is used),最顶层调用的SQL,比如执行一个function,select * from mypgio('pgio4', 50, 3000, 131072, 255, 8);就会出现在这里。3)query: the statement being executed (not normalised, as it is in pg_stat_statements, means you see the values)4)cmdtype: the statement type (SELECT,UPDATE,INSERT,DELETE,UTILITY,UNKNOWN,NOTHING)5)queryid: the queryid of the statement which links to pg_stat_statements6)blockers: the number of blockers7)blockerpid: the pid of the blocker (if blockers = 1), the pid of one blocker (if blockers > 1)8)blocker_state: state of the blocker (state of the blockerpid)另外,还多了一个pg_stat_statements_history视图(通过周期采样pg_stat_statements而来),需要先添加一下GUC参数pgsentinel_pgssh.enable=true
GUC参数总共如下:
1)pgsentinel_ash.sampling_period:采样周期,默认为1s
2)pgsentinel_ash.max_entries:pg_active_session_history视图在内存中的环形缓冲区的大小,这个和shared_buffers中的环形缓冲区(默认256KB)类似,如果没有环形缓冲区直接批量读取写入等,那么所有存储在缓冲区的页面都会被置换掉,导致后续的缓存命中率降低。
3)pgsentinel.db_name:要连接的数据库
4)pgsentinel_ash.track_idle_trans:在idle in transaction的状态下跟踪会话
5)pgsentinel_pgssh.max_entries:pg_stat_statements_history视图在内存中的环形缓冲区的大小
6)pgsentinel_pgssh.enable:是否允许pg_stat_statements_history视图进行采样
然后模拟一下进行增删改,视图里就可以采样到数据了,同时根据queryid,可以和pg_stat_statements/pg_stat_statements_history进行join
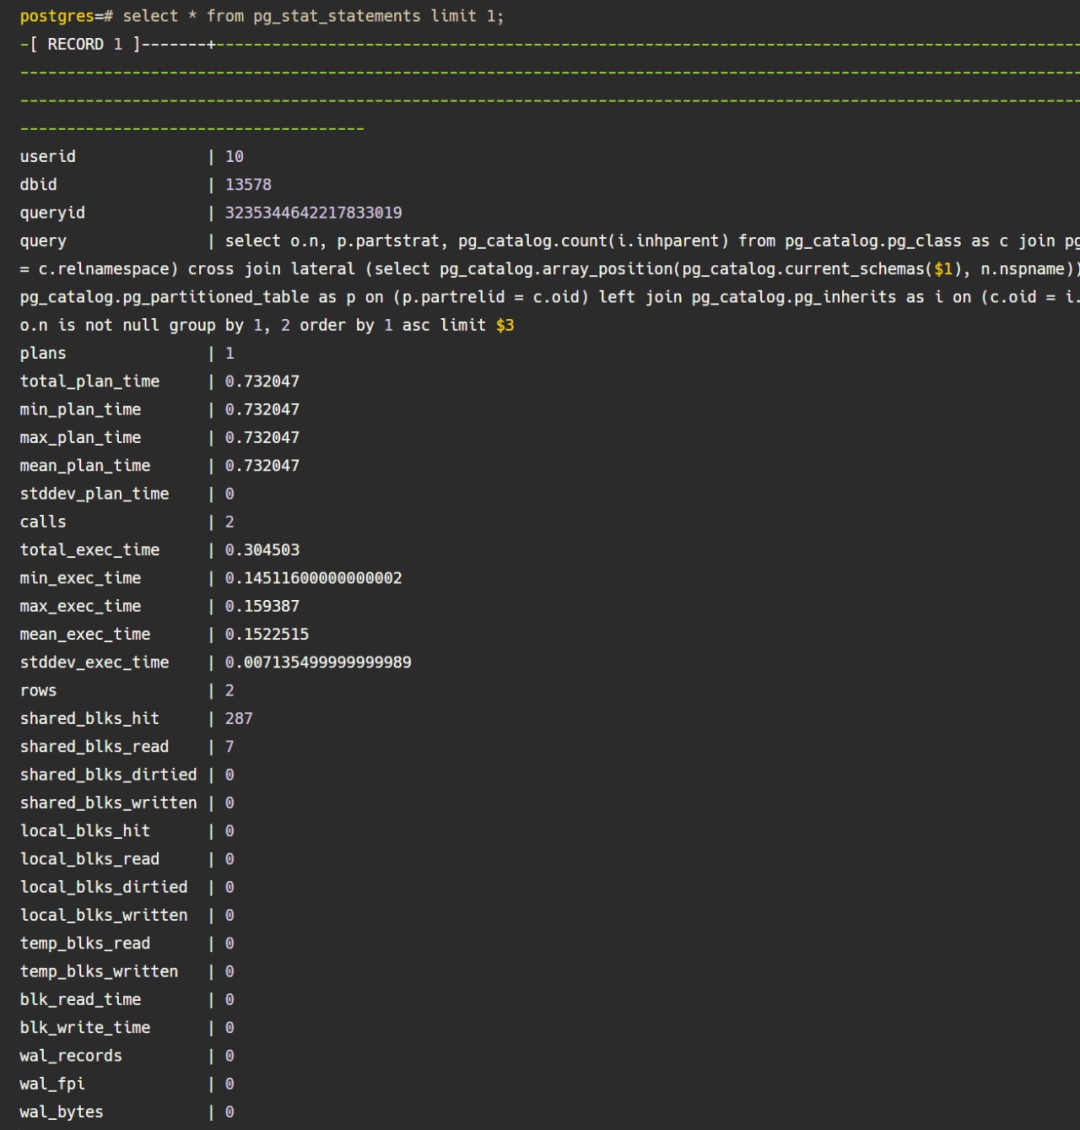
最新版本的pg_stat_statements丰富了很多:如planning的时间、真正execute的时间,以及该语句生成了多少wal,多少次FPI全页写等
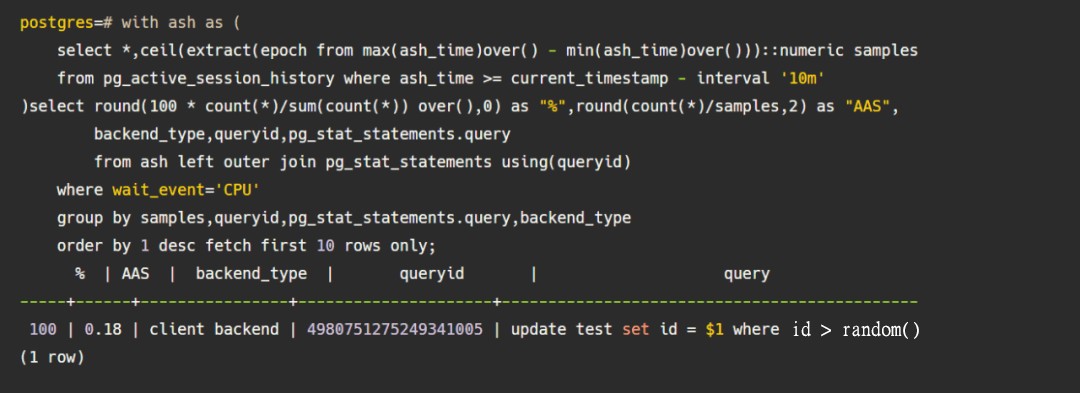
3.充分利用
with ash as ( select *,ceil(extract(epoch from max(ash_time)over() - min(ash_time)over()))::numeric samples from pg_active_session_history where ash_time >= current_timestamp - interval '10m')select round(100 * count(*)/sum(count(*)) over(),0) as "%",round(count(*)/samples,2) as "AAS", backend_type,queryid,pg_stat_statements.query from ash left outer join pg_stat_statements using(queryid) where wait_event='CPU' group by samples,queryid,pg_stat_statements.query,backend_type order by 1 desc fetch first 10 rows only;
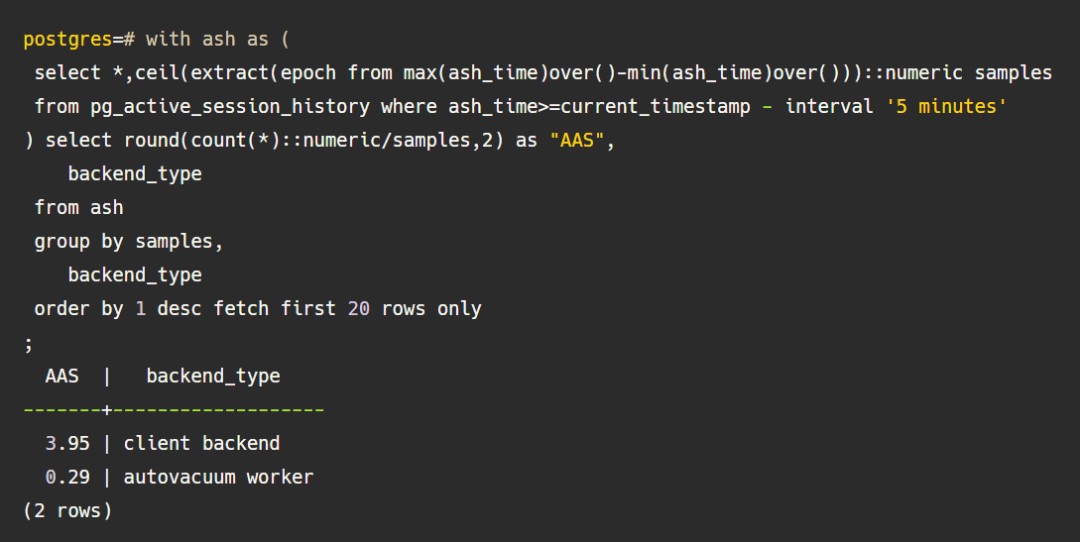
with ash as ( select *,ceil(extract(epoch from max(ash_time)over()-min(ash_time)over()))::numeric samples from pg_active_session_history where ash_time>=current_timestamp - interval '5 minutes') select round(count(*)::numeric/samples,2) as "AAS", backend_type from ash group by samples, backend_type order by 1 desc fetch first 20 rows only;
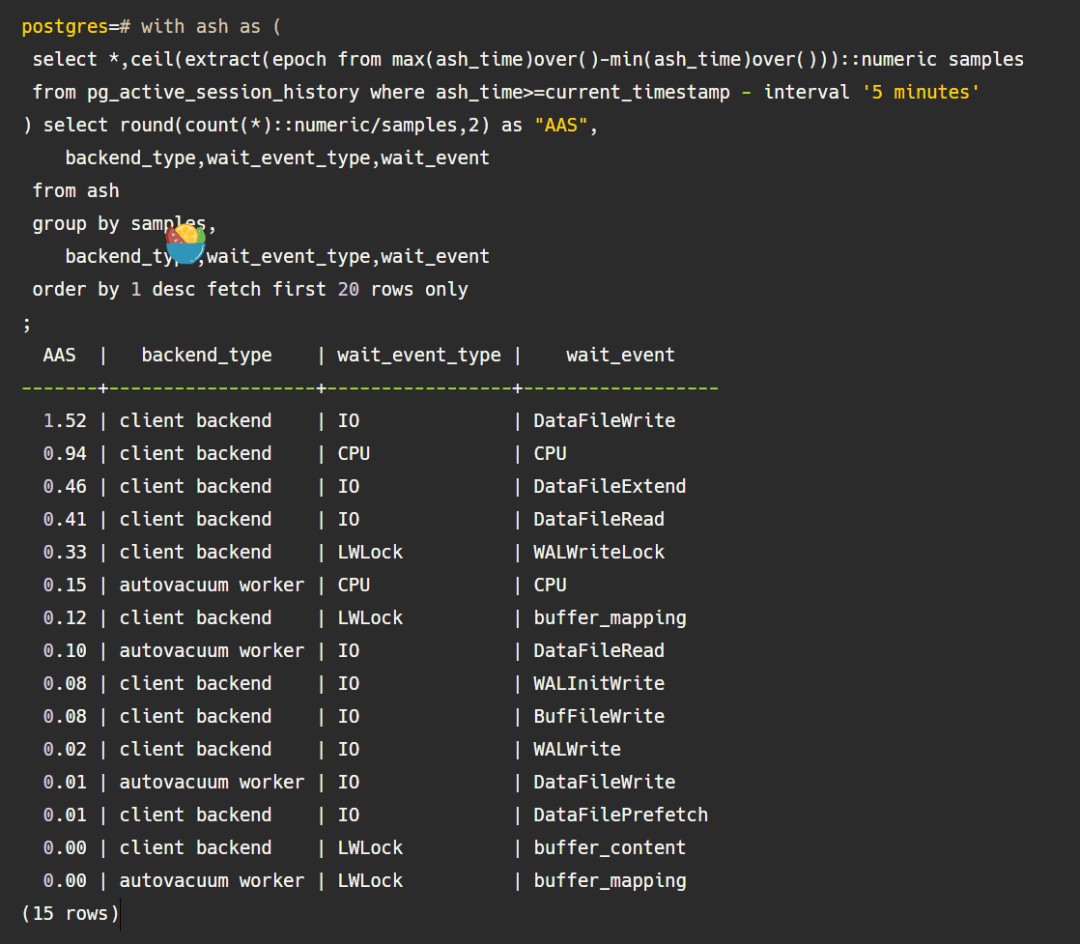
with ash as ( select *,ceil(extract(epoch from max(ash_time)over()-min(ash_time)over()))::numeric samples from pg_active_session_history where ash_time>=current_timestamp - interval '5 minutes') select round(count(*)::numeric/samples,2) as "AAS", backend_type,wait_event_type,wait_event from ash group by samples, backend_type,wait_event_type,wait_event order by 1 desc fetch first 20 rows only;
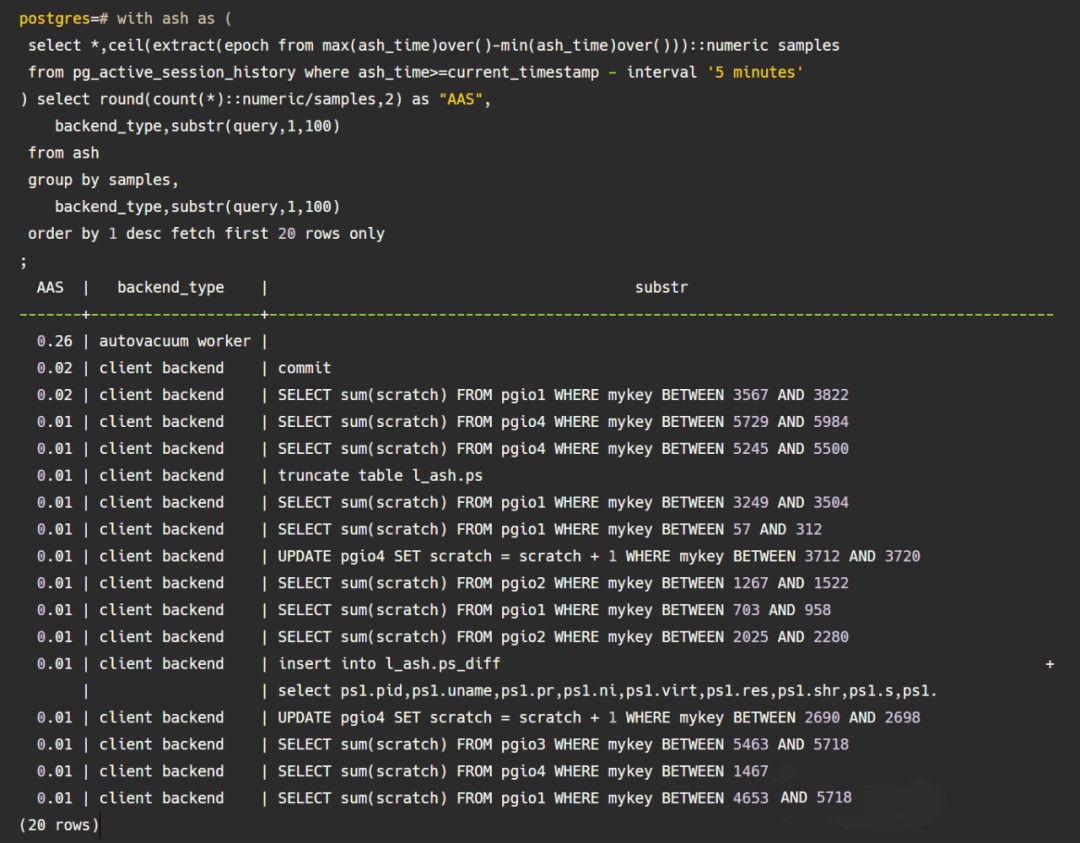
with ash as ( select *,ceil(extract(epoch from max(ash_time)over()-min(ash_time)over()))::numeric samples from pg_active_session_history where ash_time>=current_timestamp - interval '30 minutes') select round(count(*)::numeric/samples,2) as "AAS", backend_type,substr(query,1,100) from ash group by samples, backend_type,substr(query,1,100) order by 1 desc fetch first 20 rows only;
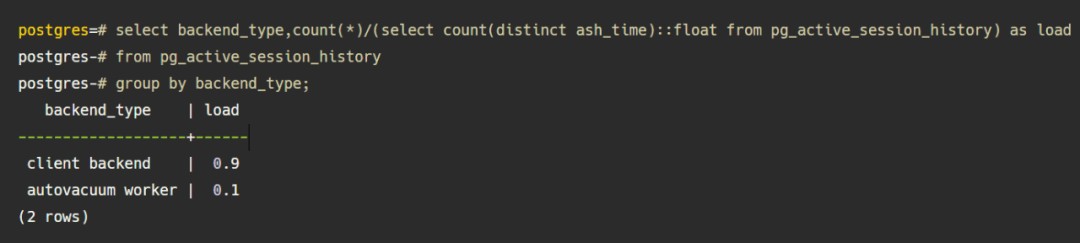
select backend_type,count(*)/(select count(distinct ash_time)::float from pg_active_session_history) as loadfrom pg_active_session_history group by backend_type;
更多用法请参照:https://www.youtube.com/channel/UCGVciSS2YwnPhtHHGB3Ep3A
4.小结
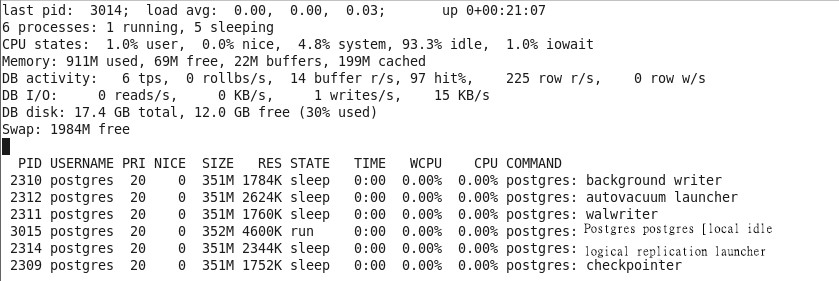
pg_stat_statements视图可以用来记录和追溯慢SQL,而pgSentinel的好处就是,通过采样,将最近一段时间的性能指标和运行状态记录下来,比如过去30分钟有应用明显变慢,那么就可以根据pg_active_session_history的backend_start或query_start等时间戳字段来过滤,找到当时的运行状态信息,再结合pg_stat_statements找到元凶SQL,追本溯源。而对于观察某一个时刻的状态,除了pg_stat_activity,还推荐pg_top这个工具,专门为postgresql定制的top。https://github.com/markwkm/pg_top