程序报segfault(段错误)怎么定位?
程序的段错误(segfault)肯定是最让人头疼的错误了,关键是很难下手定位,这不手动碰到一个case,gitlab通过独立的nginx代理,git clone的时候通过ssh没有什么问题,但是通过 https方式clone,报如下错误:
1,在gitlab服务器上clone

2,在其他机器上clone

总之服务器没有正常给客户端返回信息啦
同时在服务器上的/va/log/message 下面出现一条报错信息
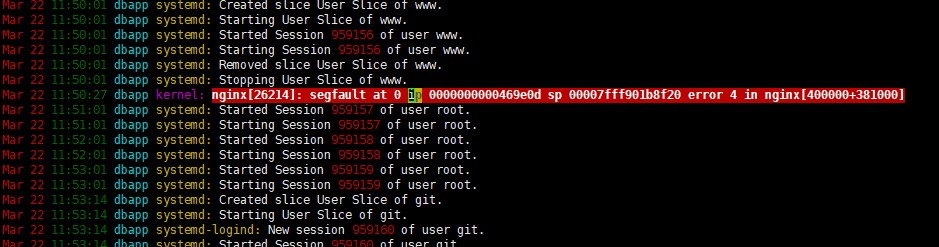
对于这类报错信息,想定位程序位置,一条最简单的使用 addr2line 命令,命令具体使用可以 man addr2line
对于题目中的 nginx segfault 我们需要:
addr2line -e /webdata/opt/local/tengine/sbin/nginx 0000000000469e0d -f -C
其中-e 后面是程序启动执行的二进制程序,本例中的是nginx可执行文件路径 ,后面的“段”地址为 "ip" 后面那部分内存地址。-f 显示问题函数名,-C 把 一些符号有低级进制转换成用户可以识别的符号。执行结果为:

根据上面提示,应该是dso 模块有问题了,这个是和ssl模块有关系,更换nginx到 tengine-2.3.2 之后 git clone https:// 正常了
还有另外一种方式,通过内核的转储文件。默认内核转储文件是被禁止的,可以通过ulimit -a 查看 core file size 默认为0:禁止kernal转储。
下文是nginx 的debugging方式:
Debugging log
See a debugging log in documentation for details.
To activate debugging log you have to compile NGINX with –with-debug configure option and set debug level in error_log directive.
It’s possible to debug only connections from specified addresses via debug_connection directive.
Note
In hard cases (e.g. debugging event method related problems) it’s good idea to obtain full debugging log by setting debug level in global error_log.
Core dump
To obtain core dump you usually have to tune your OS. Though NGINX simplifies some typical cases and usually adding
worker_rlimit_core  500M;
working_directory   /path/to/cores/;
to nginx.conf is enough. Then run gdb to obtain backtrace as usual, e.g.
gdb /path/to/nginx /path/to/cores/nginx.core
backtrace full
If your gdb backtrace warns that No symbol table info available. then you will need to recompile NGINX with the appropriate compiler flags for debugging symbols.
The exact flags required depend on the compiler used. If you use GCC, the flag -g enables the inclusion of debugging symbols. Additionally disabling compiler optimization using -O0 will make the debugger output easier to understand.
CFLAGS="-g -O0" ./configure ....
Socket leaks
Sometimes socket leaks happen. This usually results in [alert] 15248#0: open socket #123 left in connection 456 messages in error log on NGINX reload/restart/shutdown. To debug add
debug_points abort;
to nginx.conf and configure core dumps (see above). This will result in abort() call once NGINX detects leak and core dump.
Something like this in gdb should be usefull (assuming 456 is connection number from error message from the process which dumped core):
set $c = &ngx_cycle->connections[456]
p $c->log->connection
p *$c
set $r = (ngx_http_request_t *) $c->data
p *$r
In particular, p $c->log->connection will print connection number as used in logs. It will be possible to grep debug log for relevant lines, e.g.
fgrep ' *12345678 ' /path/to/error_log;
- 发表于 2020-04-01 15:34
- 阅读 ( 54 )
