死锁问题排查和查询sql语句。
晚上做mysql RR级别锁测试时候,遇到一个死锁,执行
select * from test_gap_lock where id > 100 for update; 一直被锁定,
通过show full processlist 查看发现 info字段为空,如图
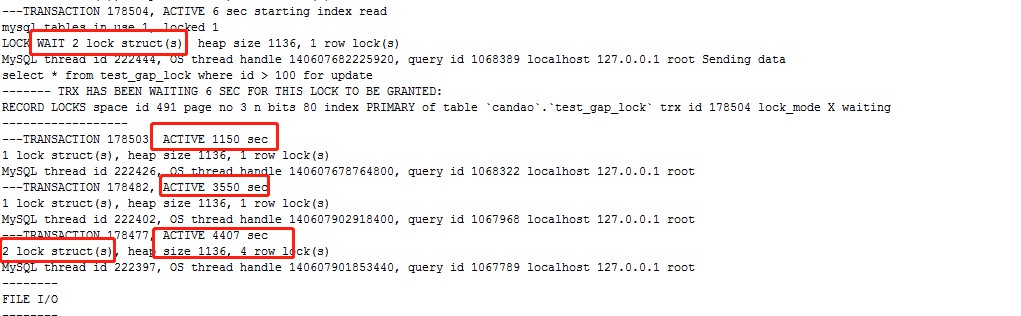
可以看到确实有三个长时间活跃的事务,事务的sql语句无从得到。
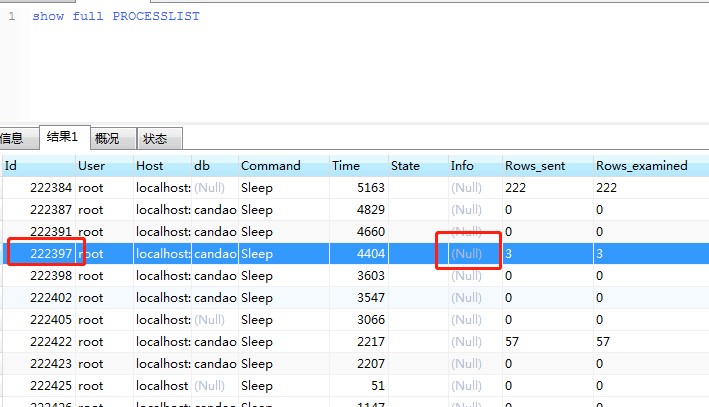
show full processlist中 的info为空,知不道是什么语句阻塞。
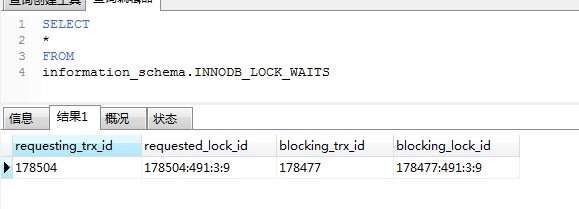
通过information_schema 钟的innodb_lock_waits 可以初步查到阻塞的事务id
可以通过此事务id找到对应的thread_id 然后kill掉就行了,
但这里还有点问题是,不知道到底是什么sql阻塞了,下面几个语句详细查询阻塞的sql语句的。
若出现
[Err] 3167 - The ‘INFORMATION_SCHEMA.GLOBAL_STATUS’ feature is disabled; see the documentation for ‘show_compatibility_56’
请执行:
set global show_compatibility_56=on;
show variables like '%show_compatibility_56%';
来兼容5.6
一,使用information_schema 来查询哪条sql阻塞,谁在等待方法
SELECT
p2.`HOST` 被阻塞方host,
p2.`USER` 被阻塞方用户,
r.trx_id 被阻塞方事务id,
r.trx_mysql_thread_id 被阻塞方线程号,
TIMESTAMPDIFF(
SECOND,
r.trx_wait_started,
CURRENT_TIMESTAMP
) 等待时间,
r.trx_query 被阻塞的查询,
l.lock_table 阻塞方锁住的表,
m.`lock_mode` 被阻塞方的锁模式,
m.`lock_type` "被阻塞方的锁类型(表锁还是行锁)",
m.`lock_index` 被阻塞方锁住的索引,
m.`lock_space` 被阻塞方锁对象的space_id,
m.lock_page 被阻塞方事务锁定页的数量,
m.lock_rec 被阻塞方事务锁定行的数量,
m.lock_data 被阻塞方事务锁定记录的主键值,
p.`HOST` 阻塞方主机,
p.`USER` 阻塞方用户,
b.trx_id 阻塞方事务id,
b.trx_mysql_thread_id 阻塞方线程号,
b.trx_query 阻塞方查询,
l.`lock_mode` 阻塞方的锁模式,
l.`lock_type` "阻塞方的锁类型(表锁还是行锁)",
l.`lock_index` 阻塞方锁住的索引,
l.`lock_space` 阻塞方锁对象的space_id,
l.lock_page 阻塞方事务锁定页的数量,
l.lock_rec 阻塞方事务锁定行的数量,
l.lock_data 阻塞方事务锁定记录的主键值,
IF (p.COMMAND = 'Sleep', CONCAT(p.TIME,' 秒'), 0) 阻塞方事务空闲的时间
FROM
information_schema.INNODB_LOCK_WAITS w
INNER JOIN information_schema.INNODB_TRX b ON b.trx_id = w.blocking_trx_id
INNER JOIN information_schema.INNODB_TRX r ON r.trx_id = w.requesting_trx_id
INNER JOIN information_schema.INNODB_LOCKS l ON w.blocking_lock_id = l.lock_id AND l.`lock_trx_id`=b.`trx_id`
INNER JOIN information_schema.INNODB_LOCKS m ON m.`lock_id`=w.`requested_lock_id` AND m.`lock_trx_id`=r.`trx_id`
INNER JOIN information_schema. PROCESSLIST p ON p.ID = b.trx_mysql_thread_id
INNER JOIN information_schema. PROCESSLIST p2 ON p2.ID = r.trx_mysql_thread_id
ORDER BY
等待时间 DESC;
二,计算60s内差生binlog大小
explain select @a1:=VARIABLE_VALUE as a1
from information_schema.GLOBAL_STATUS
where VARIABLE_NAME='innodb_os_log_written'
union all
select sleep(60)
union all
select @a2:=VARIABLE_VALUE as a2
from information_schema.GLOBAL_STATUS
where VARIABLE_NAME='innodb_os_log_written';
select round((@a2-@a1)/1024/1024/@@innodb_log_files_in_group) as MB;
三:查看事务等待情况
select
r.trx_id waiting_trx_id,
r.trx_mysql_thread_id waiting_thread,
r.trx_query waiting_query,
b.trx_id blocking_trx_id,
b.trx_mysql_thread_id blocking_thread,
b.trx_query blocking_query
from
information_schema.innodb_lock_waits w
inner join information_schema.innodb_trx b on b.trx_id = w.blocking_trx_id
inner join information_schema.innodb_trx r on r.trx_id = w.requesting_trx_id;
四,更详细的事务等待情况
select
b.trx_state,
e.state,
e.time,
d.state as block_state,
d.time as block_time,
a.requesting_trx_id,
a.requested_lock_id,
b.trx_query,
b.trx_mysql_thread_id,
a.blocking_trx_id,
a.blocking_lock_id,
c.trx_query as block_trx_query,
c.trx_mysql_thread_id as block_trx_mysql_tread_id
from
information_schema.innodb_lock_waits a
left join information_schema.innodb_trx b on a.requesting_trx_id = b.trx_id
left join information_schema.innodb_trx c on a.blocking_trx_id = c.trx_id
left join information_schema.processlist d on c.trx_mysql_thread_id = d.id
left join information_schema.processlist e on b.trx_mysql_thread_id = e.id
order by
a.requesting_trx_id;
五:查看当前活跃的事务
select
a.trx_id,
a.trx_state,
a.trx_started,
a.trx_query,
b.id,
b.user,
b.db,
b.command,
b.time,
b.state,
b.info,
c.processlist_user,
c.processlist_host,
c.processlist_db,
d.sql_text
from
information_schema.innodb_trx a
left join information_schema.processlist b on a.trx_mysql_thread_id = b.id
and b.command = 'sleep'
left join performance_schema.threads c on b.id = c.processlist_id
left join performance_schema.events_statements_current d on d.thread_id = c.thread_id;
- 发表于 2018-09-06 04:14
- 阅读 ( 50 )
