PhpStorm配置Xdebug最完整最详解教程,100%成功!
前言
很多人好奇网上关于php配置xdebug的教程那么多,为什么我还要写这篇文章?
因为网上的教程配置很乱,很多都是复制粘贴,有些配置项根本不需要,也不解释干嘛的,而且不够详细。
本教程主要应用于Windows,Mac和Linux基本上同理。
今天配置xdebug的时候,默认的php.ini 文件中添加扩展一直不生效,后来通过 <?php
var_dump(php_ini_loaded_file(), php_ini_scanned_files()); 查询默认的配置文件加载为:php-cli.ini 不是默认的php.ini 文件!!!
/*********************************************************************************************
Enable remote debugging in your php.ini:
For Xdebug v3.x.x:
xdebug.mode = debug
xdebug.start_with_request = yes
For Xdebug v2.x.x:
xdebug.remote_enable = 1
xdebug.remote_autostart = 1
xdebug.remote_port = 9000
There are other ways to tell Xdebug to connect to a remote debugger, like cookies, query parameters or browser extensions. I recommend remote_autostart (Xdebug v2)/start_with_request (Xdebug v3) because it "just works". There are also a variety of other options, like the port, please see the Xdebug documentation on remote debugging for more information. Please note that the default Xdebug port changed between Xdebug v2 to v3 from 9000 to 9003.
【还有其他方法告诉 Xdebug 连接到远程调试器,如 cookie、查询参数或浏览器扩展。 我推荐remote_autostart(Xdebug v2)/start_with_request(Xdebug v3),因为它 "就是好用"。 还有其他一些选项,如端口,请参阅 Xdebug 远程调试文档了解更多信息。 请注意,从 Xdebug v2 到 v3,默认的 Xdebug 端口已从 9000 改为 9003。】
**********************************************************************************************************************/
配置xdebug扩展
只配置Debug,不配置profiler和trace,profiler和trace干嘛的请百度。
因为大多数情况下是单用户调试,所以不需要配置多用户参数,
如:php.ini 文件 xdebug.idekey 参数和 PhpStorm的Debug -> DBGp Proxy 。
xdebug2.x版本php.ini配置如下:
zend_extension = php_xdebug.dll
xdebug.remote_enable = On
xdebug.remote_host = localhost
xdebug.remote_port = 9100
xdebug3.x版本php.ini配置如下:
zend_extension = php_xdebug.dll
xdebug.mode = debug
xdebug.client_host = localhost
xdebug.client_port = 9100
xdebug官网下载地址:https://xdebug.org/download.php
扩展一定要装对,注意区分ts和nts版本,phpinfo()查看扩展是否成功。
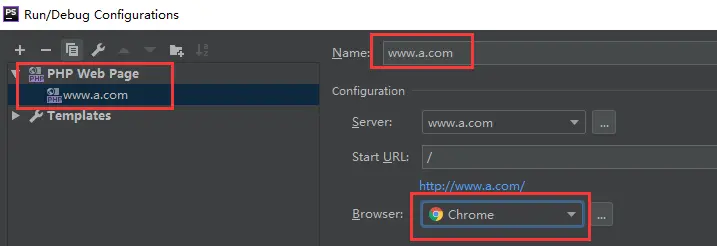
设置PhpStorm
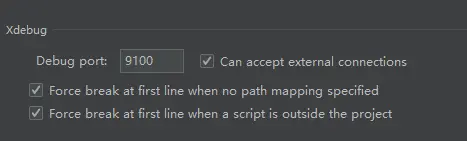
打开PhpStorm,菜单 File -> Settings ,然后找到 PHP -> Debug
设置Debug port为9100
为什么不是9000?因为会和一些集成环境的php-cgi或者php-fpm端口冲突.
触发断点调试
在你需要的代码处打断点,这是基础和必须,就不多介绍了。
触发PhpStorm的debug方式主要有两种:
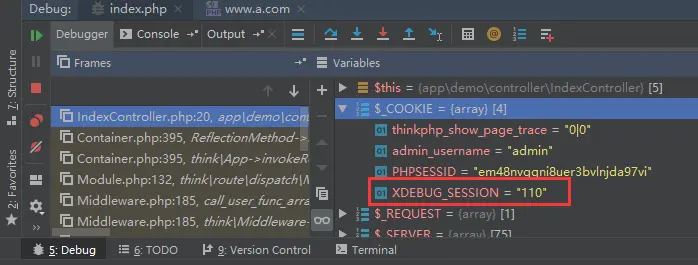
1,GET、POST存在XDEBUG_SESSION_START 参数或者cookie里存在XDEBUG_SESSION,单用户调试 值随意。GET、POST
会生成cookie XDEBUG_SESSION,有效期为1个小时(可修改php.ini配置)。很多教程需要下载Xdebug helper等浏览器插件,
原理就是请求里附加cookie。
2,php.ini 文件 xdebug.remote_autostart 参数设置为 On 或者1,无需设置GET、POST、cookie。(不推荐,虽然不需要设置参数,
设置针对环境,而不是项目,还要重启php环境)
浏览器调试
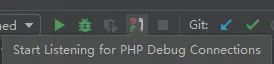
针对第 1 种,教大家用一种更简单的方式,不需要下载浏览器插件。
找到PhpStorm右上角
然后点小甲虫图标
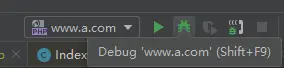
会打开浏览器访问你的url,并且携带GET参数XDEBUG_SESSION_START,同时生成cookie XDEBUG_SESSION,
也就是说,下次(cookie有效期1小时)
无需点击小甲虫,浏览器直接输入,如 www.a.com 或 www.a.com/chat/1/ 即可触发调试
Postman接口调试
针对第 1 种,Postman触发方式如图
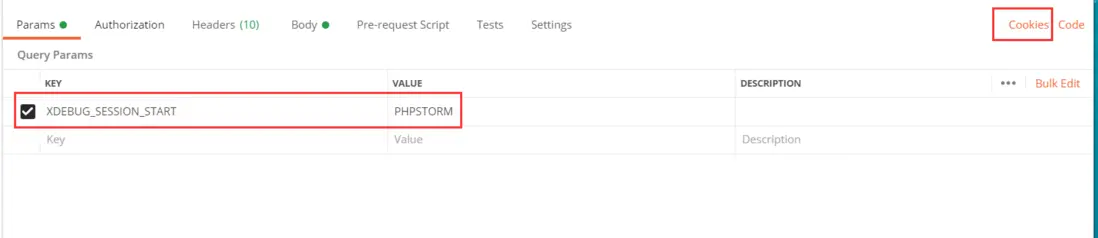
可以直接添加GET、POST参数,在请求结束后,会自动附加cookie XDEBUG_SESSION,也可以手动添加cookie XDEBUG_SESSION。
xdebug3 新版本配置
xdebug.mode = debug ;开启debug
xdebug.client_host = "127.0.0.1"
xdebug.client_port = 9001
xdebug.collect_return=On
- 发表于 2024-08-31 03:19
- 阅读 ( 69 )
